Playing around with Python could result satisfactory. The other day I was wondering, what is the correlation in the movements of some of the main coins. Here is the process, the step by step, to get to some conclusions in 10 simple lines of code.
- I needed to import the libraries:
- Find the paths for the right prices:
- Creating a dictionary for csv:

- Change the data from Hour to Day:

- Creating the index:

- Merging close dates:

- Correlations:

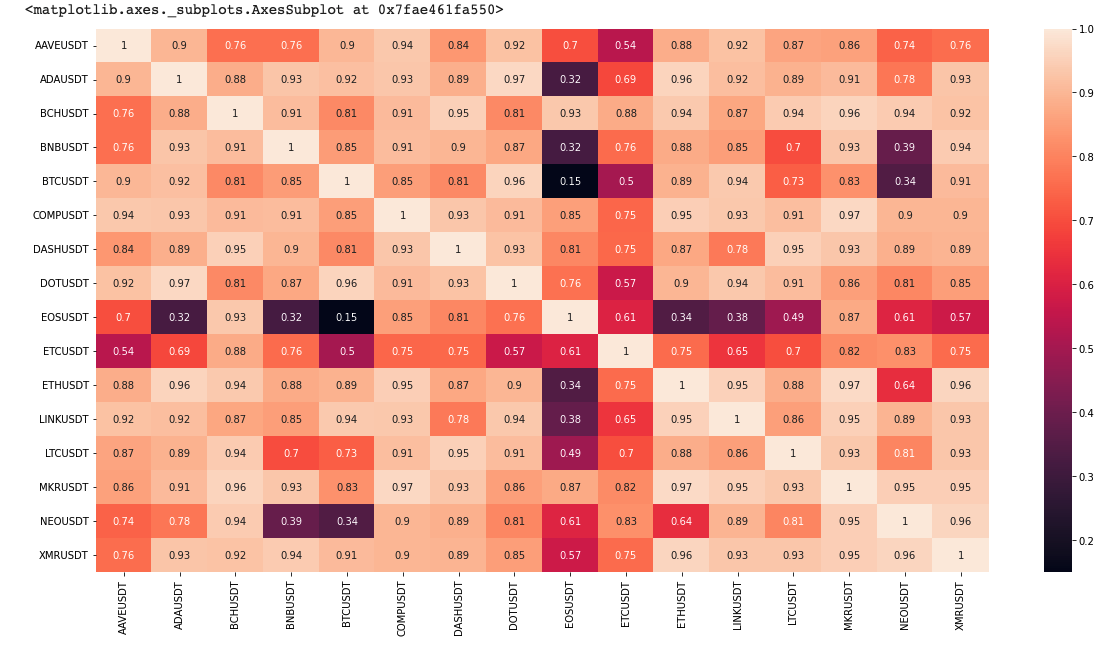
- Generating the heatmap:

The closer it is the index to 1, the more correlated the coins are in the price movements. It’s quite cool in order to understand how the market fluctuates. All of them have positive correlation, this means that when one goes up, the other one follows, and viceversa.


